


Mania: “extreme enthusiasm for something that is usually shared by many people”, source Merriam-Webs
- Aug 30, 2015
- 8 min read
Mania: “extreme enthusiasm for something that is usually shared by many people”, source Merriam-Webster. Yes, I will discuss the markets, plus comments and thoughts
The full definition of Mania, as provided by Merriam-Webster may be very appropriate for periods of global market activity over the last 10 trading days.

Discussion of Mechanics of Modern Markets and its Impact
Possibly 2a above is most appropriate, as it refers to either or both “excessive” and “unreasonable”. Before we get into the details, today we are in a period whereby structurally the US markets and many other international markets are highly subject to excesses and lack of reason as there is little objective, thoughtful and disciplined investing going on today. In the long run, disciplined investing should produce above average risk-adjusted returns, but in the short run (I.e., seconds, minutes, hours and days) reason and logic may get trampled by the mania of the day or week.
Some major changes to the markets as technology and communications have evolved since the early 1990’s include the rise of:
Exchange Traded Funds
High Frequency Traders
Dark, Black and Grey Pools
ECNs (Electronic Communications Networks)
Alternative Trading Systems
Algorithmic Trading
Dark Pool Aggregators
Other than Exchange Traded Funds, the items on the list are almost exclusively in the playing ground of large institutional investors. Once upon a time, markets had “market makers” and traders working and managing the orderliness of markets as a component of their responsibilities of membership in their exclusive “club”. Today, most trading is done by algorithms developed by phds and computer scientists, utilizing the latest stream of digital data, interpreting it and processing it, to reach trading conclusions. These trades are then digitally routed instantaneously with zero or very limited human intervention.
Can computer program be described as “manic”? Likely not, but its impact on pricing and volume, and the feelings we humans then feel as a result of the movements, may potentially be described as manic.
The Securities and Exchange Commission was established with one objective to promote transparency and fairness. One effect of the “off exchange” trades coordinated by ECNs is that there is only limited visibility into many trades, and thus, though the markets may remain “efficient”, they are moving faster than we can see with the naked eye, or something like that……….. http://www.quantprinciple.com/invest/index.php/docs/realworld/darkpools/#tape
Bottom line, when you have computers feeding on other computers, you have what I have technically termed an “echo effect”, where a valid news story has an impact on the market, but that impact is then interpreted by the algorithms which produce trades and further move the price and volume, which then has further impacts on the markets.
This echo effect was clearly visible between last Friday and this past Tuesday. There was NO new news that would have created the chaos we saw on Monday. There was new news on Monday morning, and it was very positive, and the market was so wrapped up in itself and the down 1,000 points on the DJIA that such news was not built into many new decisions until later in the week.
There are many, many pundits, managers and newsletter writers (as well as publishers, book writers and others) who are stating that such chaos we have witnessed would not have happened unless there was certainly some major things that we should be worrying about…. I am not so sure they are as correct as the confidence they demonstrate.
The Past Few Days on the Markets
Chart Source: http://www.marketwatch.com/


As shown in the charts, there were precipitous declines between the 17th and 24th and then it appears that some semblance of rationality began to take hold.
History will likely show that these days between the 17th and the 24th were a flash crash in slow motion….. by this past Friday, August 28th, the markets appeared to regain their composure and to function close to “normal”.
Economic News over the past week:
It is important to note that all economic news and data points are looking at activity over the past week or month. The data does not reflect any economic activity that was happening on the day of the release or subsequent. Thus, the effects of the market chaos over the past 10 days COULD have an impact on economic activity, if buyers or goods or service change their orders, payments, pricing, etc. as a result of the past 10 days of experiences. We have out feelers to local business people to inform us if they see or feel any changes in engagement or flow as a result of the market turmoil. We will feedback to you as we hear updates.
Chicago Fed National Activity Index – (Released Monday) The index came in at +0.34 for July versus -0.07 for June. This index is structured to measure 85 different national variables and indicates the strength and direction of trends. “Forty-four indicators improved from June to July, while 40 indicators deteriorated and one was unchanged. Of the indicators that improved, 12 made negative contributions.” “Limited” inflationary pressure is expected as a result of the findings. https://www.chicagofed.org/publications/cfnai/index
New Home Sales – (Released Tuesday) Came it at 507k versus prior month of 481k and concensus of 494k to 531k. Year over year sales pace has increased by 26%! Year over year pricing is up a limited 2%. Thus, the new supply seems to meeting demand head on, without significant pressures. https://www.census.gov/construction/nrs/index.html
Consumer Confidence – (Released Tuesday) Came in at 101.5 for August versus 91 for July. There was a significant gain in employment and work opportunity readings. https://www.conference-board.org/data/consumerconfidence.cfm

Durable Goods Orders – (Released Wednesday) New orders were up 2.0% in July, beating expectations. Capital goods Ex Transportation was up 0.6%. Both shipments and unfilled orders increased as well during the month. When looking at yr/yr numbers, there is a significant decline which is exclusively attributed to aircraft sales booked last year. https://www.census.gov/manufacturing/m3/adv/pdf/durgd.pdf
Crude Oil Inventories – (Released Wednesday) Gasoline and distillates inventories were marginally higher week over week, but crude inventories fell by 5.5M barrels.

GDP – (released Thursday) This release was a revision of the 2nd Quarter’s preliminary GDP report. It can be revised one more time. The initial estimate was 2.3% growth, and this was revised to an annual growth rate of 3.7%. Interestingly, the inflation component of the index did show an annualized increase of 2.1%, slightly above the Fed’s target. Biggest drivers were new home purchases and new car sales. Also contributing was increases in net exports and inventory levels. http://www.bea.gov/newsreleases/national/gdp/gdpnewsrelease.htm
Jobless Claims – New filings for unemployment insurance (released Thursday) came in with a very good number of 271k. The unemployment rate for insured workers was calculated at 1.7%. Employment figures look very good, with no material negative changes for the week of August 22nd.

US Corporate Profits: (Released Thursday) US corporate profits, after including an inventory value adjustment (which the Bureau of Economic Analysis equates to Profits from Current Production), came in at $2 trillion versus $1.795 trillion for the same quarter last year, for an increase of 11.4% yr/yr. Profits were up 2.1% from the first quarter. http://www.bea.gov/iTable/iTable.cfm?ReqID=9&step=1#reqid=9&step=3&isuri=1&903=239
The Federal Reserve Balance Sheet: (Released Thursday) Charts show that the balance sheet has been stable for the past year, with maturing securities replaced with new purchases, so as to maintain portfolio size. Keep in mind that the Fed could decide to not reinvest maturities and thus cease to be a buyer of fixed income, which would drive up interest rates……..

Money supply is always interesting to watch, especially if there are any changes underfoot. Clearly, based on the chart below, there are no changes…..

Personal Income and Outlays: (Released Friday) The July 2015 results were released and they indicated that the households continue to improve, though marginally. Personal incomes were up 0.4% and personal consumption expenditures were up 0.3%. http://www.bea.gov/newsreleases/national/pi/2015/pdf/pi0715.pdf The report highlighted that inflation remains very, very low. Economists did not see support in these numbers for a Fed rate increase.
US Consumer Sentiment: (Released Friday) Consumer sentiment came in slightly lower than expected at 91.9 vs consensus of 92.7 to 95. The slight decline may be based on the slight shift in fears arising from the slide in the Chinese markets and a bit of the volatility that subsided this past week. (We will watch closely at the next release, 9/11 at 10 am.) Based upon the 10 year chart below, it is clear that sentiment remains high.

Government Released Chinese Consumer Sentiment:

Westpac MNI China Consumer Sentiment Indicator:

Moody’s Projections of China and Global Growth: (Released Friday) Moody’s Investor Services reduced its growth projections for China to 6.3% from 6.5% previously for 2016. China is targeted to grow by 7% in 2015, per the Chinese government. Global growth was cut to 2.8% from 3.1%. Citigroup similarly cut their Chinese and global growth figures blaming weakening outlooks for China, the Euro area and Japan. Economists in a Bloomberg survey earlier this month averaged 3.5% expected expansion down from 3.6% in the prior month’s survey.
Per the referenced Bloomberg article: “With exports to China representing less than 1 percent of U.S. output, a Chinese slowdown to even 5 percent annual growth probably won’t have a significant effect on the American economy, said Torsten Slok, chief international economist at Deutsche Bank AG in New York. “If I look at fundamentals in the U.S., I just don’t see any evidence of a slowdown. I don’t think China has had any significant impact, at least to this point,” Slok said in a phone interview.”
2nd Quarter Earnings: Of 490 of the 500 companies in the S&P500 reporting, 74% reported earnings above the analysts’ mean estimates and 50% reported sales above the mean estimate. The 74% is above the five year average and the 50% is below the 5 year average, Factset has noted. Per Factset, if energy were excluded from the S&P 500, revenue growth for the second quarter would have been a positive 1.5%.

Sources of revenues for S&P 500 Companies: Per Factset, revenues of the S&P 500 companies are generated 70% from North America (mostly the US), 15% Europe, and 9% Asia (including Japan and China). Based on managements’ comments during the 2nd Quarter presentations of earnings, foreign currency impacts have been significantly greater than impacts of changing internal economics and demand within Europe and Asia.
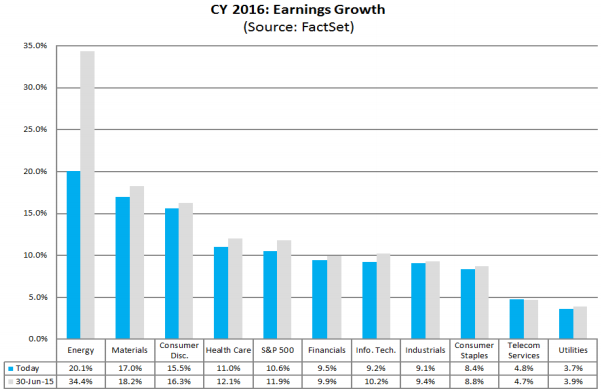
2016 Projected S&P 500 Earnings Growth:
Conclusion:
I apologize for the depth and breadth of the analysis within this newsletter. There was much ground to cover and many facts to examine.
It seems that, as long as the chaos of the markets from the past 10 days does not translate into effects on buying and non-security investment decisions, things should continue to move forward reasonably well. As we saw in the 2nd Q, the biggest impacts on US companies operating internationally will likely not be from effects in changing economic conditions but in changes in the US Dollar exchange rate and its impact on its financial results and statements.
We are watching closely for hints of true impact and changes in buying and investing and building behavior, but in the short few days we have seen no hints of any impact. It likely would take several weeks to flow through to actions, but if the market shows some form of normalcy, likely no notable actions will be taken.
The Fed is definitely the major wild card. Markets are typically volatile before a rate increase, but history has seen that the strength of the economy moved the markets higher, even as rates are moving higher. We know the Fed will move slowly, and I think as the markets see that, the markets will not show such violent reaction.
The likelihood of a September rate hike is less than 25% at the moment, though there is the possibility it may happen, it is highly unlikely. Any increase will be data dependent even up to the date of the meeting, so it makes no sense to hypothesis now, though it does make sense to prepare. This has been done over the past months, in preparation, so no concern should be warranted.
Please reach out with any questions at any time. Tremendous moves are horrifying and nerve-racking. If your nerves are bothersome, definitely call your advisor so they may address the issues and respond accordingly.
Let us look forward to an uneventful week, hopefully!


Comments