


New highs, limited new overly positive news - - Updates and Commentary by Howard Isaacson
- Feb 28, 2015
- 6 min read
Amazing ……… After a very tough January, the month of February ended up being the single best month for the S&P 500 since October 2011! The key factors that had buoyed the markets over the past few weeks persisted this week as well. This includes deferral of the issues with Greece, mixed economic news, mixed signals from the Fed as to when they may commence raising rates, no drastic changes to the energy market, etc.
The S&P 500 ended the week at 2104.50, marginally down from 2110.30 last Friday, though on Wednesday it hit a new all time high before trading off slightly on Thursday and Friday.

Source: www.Marketwatch.com
The 10 year Treasury rates ended at 1.99%, down from 2.12% last week, reversing its 3 week upward trend. (Given the timing of the moves, it appears they were significantly influenced by Chair Yellen’s comments to Congress on Tuesday and Wednesday, as well as other Fed officials media comments on Thursday and Friday. IMHO, I heard that they have not reach any conclusions and are waiting for and watching new data, esp. re wage and price growth, employment, and economic growth. As you will read below, the news this week was mixed, encouraging continued Fed patience. )
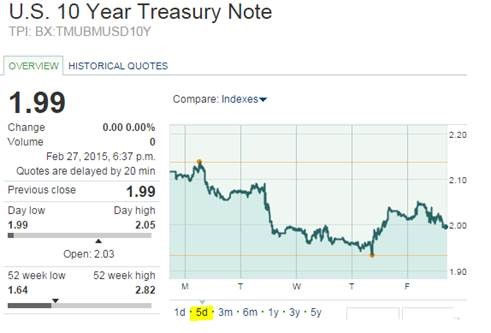
Source: www.Marketwatch.com
The German 10 year Bond Yields also reversed their bounce during the week and hit a new low before ticking higher late in the week, after ending at 0.33% last week. Here is a 3 month chart to show how significant the decline has been in their 10 year yields:

Source: www.Marketwatch.com
The Euro ended lower on the week at 1.1197 from 1.1381 last week as focuses turned to Europe’s starting of QE in March and the Fed raising rates based on comments, etc.

Source: www.Marketwatch.com
WTI Oil ended down a fraction to $49.52 from $49.91 last Friday and $52.62 two weeks back.

Source: www.Marketwatch.com
Natural gas, through flat at the start of the week moved significantly lower on the release of inventory data showing less of a reduction in inventory than expected due to the cold weather, as fears of oversupply resurfaced. Natural Gas closed the week at 2.734 per MBtu from 2.939 MBtu last Friday.

Even though average Natural Gas prices were lower at the end of the week, in the New England market prices were up 36% from last week.

With the changes summarized above, what were some of the key news items from this past week:
Walmart announced that they would, effective in April, begin paying a minimum of $9 per hour, and will increase that rate to $10 per hour next February, positively impacting 500k workers. http://www.bloombergview.com/articles/2015-02-23/wal-mart-raises-minimum-wage-as-laws-change-labor-gets-scarce Some are taking this as a sign of a tightening labor market, others are interpreting it as an attempt to step up the average quality of a Walmart worker through hiring and retention.
The week started with the Dallas Fed’s release of their Business Activity Index and Production index, with results -11.2 and 0.7, respectively. The latter index indicates that there was little to no growth in the manufacturing levels in Texas in February. The Business Activity Index reflects levels of new orders and outlooks, which have been impacted by the slowdown in the oil (and gas) fields… https://dallasfed.org/microsites/research/surveys/tmos/index.cfm
New Home Sales came in at 481k for January vs 482k for December, in line with expectations. Median sales price fell by 2.6% to $294k. http://www.census.gov/construction/nrs/pdf/newressales.pdf
Existing home sales for January were reported at an annualized rate of 4.82m units, down from 5.07m units in December. The m/m change was -4.9% and the y/y change was +3.2%. M/m declines were in all regions, with the West declining the greatest at -7.1%. Median prices declined by 4.1% to $199.6k. The decline in the sales rate resulted in an statistical increase of “inventory relative to sales” to 4.7 months from 4.4 months. The report noted that average homeowners are staying in place for an average of 10 years now versus the long term average of 7 years. This stat does not bode well for relators…. http://www.realtor.org:8119/topics/existing-home-sales/data
The Consumer Price Index came in at -0.7% m/m and -0.2% y/y, versus prior month’s -0.3% and +0.7%, respectively. Without food and energy (which are more volatile), m/m was 0.2% versus prior month of 0.1% and y/y was +1.6% versus prior month’s 1.6% as well. This tells us inflation is running below the Fed’s target and that inflation is far from an issue. The Fed is closely watching wage inflation as that could be a precursor to price increases throughout the production and selling systems… http://www.bls.gov/news.release/pdf/cpi.pdf

Source: BLS.gov
Durable goods orders for December were revised downward from -3.4% to -3.7%, but January had an increase of +2.8% m/m and +5.4% y/y. Ex transportation (primarily aircraft), prior M/M was -0.9% and current month was +0.3%, but December y/y was +3.8% and in January y/y was +4.5%. http://www.census.gov/manufacturing/m3/adv/pdf/durgd.pdf
New Jobless Claims increased to 313k from prior month’s 282k. The four week moving average ticked higher to 294.5k. http://www.dol.gov/ui/data.pdf Remember, one changing data point does not make a trend. This we will watch closely.
Consumer confidence for February was 96.4, down from 10.3.8 for January, which had been a 7.5 year high. So confidence remains strong, though not as strong as in the prior month. https://www.conference-board.org/data/consumerconfidence.cfm
GDP for the Fourth Q 2014 was revised downward from 2.6% to 2.2%, due to lower levels of actual investment. http://www.bea.gov/newsreleases/national/gdp/gdpnewsrelease.htm
In looking at the below chart, it appears that the average growth continues to accelerate (though slowly).

Consumer Sentiment was up to 95.4 for the second half of February, from 94 in early February, but down from January’s 98.1. http://www.sca.isr.umich.edu/ Overall, sentiment continues to be very positive.
The Pending Home Sales Index moved higher in January to 104.2 from a December revised figure of 102.5, which was originally released as 100.7. Strength was in the South and West, with the NE flat and MidWest down slightly. The figures are 8.4 % higher than last year. http://www.realtor.org/news-releases/2015/02/pending-home-sales-rise-in-january-to-highest-level-in-18-months
North American rig count was down this week, in the US by 43, Canada by 30, and the Gulf by 3. In both the US and Canada, we see an increase in the declining use of gas rigs, with 9 coming off line this week in the US and 17 in Canada. Here is a snapshot of the change in North American Rig Count since its peak in October 2014:

So oil rig count is down 38% from its peak and gas rig count is down 12.5%. In looking at the collapse in rig counts in 2009, the peak on September 12th, 2008 for oil, gas and in total was 413, 1606 and 2031, respectively, versus their recession lows of 183, 685 and 876, respectively, reflecting declines of 55.7%, 57.3%, and 56.9%, respectively, on June 5th, 2009. http://phx.corporate-ir.net/phoenix.zhtml?c=79687&p=irol-reportsother
Therefore, though we have seen significant shrink in the counts, and declines in capital spending plans, those capital spending declines are just kicking in now and we may see further rig count reductions before the bottom.
Crude oil inventories continued to move higher, up 19.78% since last year at this time, and +8.5 million barrels since last week. Daily US production is up 15.2% from last year, with average daily production continuing to inch higher this week over last. http://www.eia.gov/petroleum/weekly/crude.cfm#tabs-stocks-supply
In the natural gas space, this week saw the first decline in supply in a long time! Though we are up significantly year over year, the tide of increasing supply may be turning:

An interesting energy factoid I stumbled on this week:
US oil exports growing even as the Saudis try to stifle US oil growth:

Where do we go from here?
Economic data continues to be mixed, with very limited signs of tremendous strength in any areas….And this is fine. Though the talking heads continue to discuss Summer as the time for rate increases, I am not so certain looking at the current economic data. Hence, Chair Yellen’s comments of waiting and seeing make much logic. Even though a very small rate increase will not change the economic situation here in the US, the perception of rising rates could. As long as the news flow continues to be mixed, (counter to logic), the markets can meander higher. We may see a bit of volatility during the summer as we near possible “decision time”, though the second half of the year should be relatively strong.
I do want to mention that we continue to see companies (giants and smaller companies) refinancing their debt and reducing their interest costs. In some instances, especially in Europe, the rates are very close to zero! This will prove helpful in boosting earnings and dividends.
In the longer term there is excellent reason for optimism, including lower energy costs and raw materials, improved logistics, enhanced technology and increased productivity. We are currently doing a study to aggregate some of the factors we are seeing and how they may affect our macro environment over the coming years.
I wish you all a great week!


Comments