


New news, old news, slow growth grinds forward vs the Fed, oil, Greece, etc. this weeks notes - Upd
- Feb 2, 2015
- 11 min read
I want to thank all of you who read these briefings! As you know, I do write all the content, and as you can imagine, it does take a considerable amount of time to compile and then to ensure it is up to date and well thought through. Some readers go through the whole briefing and all its details, others just the beginning, plus illustrations/charts and conclusions, and others just the conclusions. However you do use this, thank you! Feel free to share it with friends or family as well. It would be my pleasure to add anyone to the distribution list, and CapitalRock does not solicit from this list. (The thoughts and comments reflected here are mine and do not reflect the opinions of CapitalRock Investments.)
Major drivers in the US markets over the past two weeks have been earnings, economic news, oil and gas pricing, Greece and the Euro, the Fed and the ECB. I will touch on all these items below. First a recap of the past two weeks in the markets:
The S&P 500 over the past three weeks. Friday brought us back to levels from mid-month:

Source: Marketwatch.com
The yield on the 10 year Treasury continued to drop, hitting a recent low of 1.64%. The 30 year Treasury hit an all time low yield of 2.243%!

If we think the US rate moves have been drastic, look at the 10 year German Bund over the past 3 months, from higher than 0.8% in November to 0.27% on 1/30/15:

As the yields on the German Bund collapsed, there was a rush to US Dollars, pushing up the value of $ vs Euro and forcing up the price of US 10 Year Treasuries, which drove the yields down.
Here is the EURO/USD over the past 2 weeks:

Prints of building deflationary pressure and slowing economic growth, combined with the issues of Greece and their future efforts to mitigate ECB/IMF mandated austerity are all issues impacting currency and interest rates.
Keep in mind the ECB has announced their QE purchases of 60 B Euro per month for 17 months, BUT it is not scheduled to start until March! http://www.euronews.com/2015/01/22/ecb-to-buy-60-billion-euros-in-bonds-per-month-from-march/ Clearly the anticipation of QE has not protected the Euro or stabilized European rates. At least the re-stimulation will start in March. Will it be too late? Too little? Will it create bubbles (other than the USD and Bonds…)?
Here is WTI Crude since the start of the year. We saw a significant bounce off recent lows of this week on Friday. (See below for more discussion.)

Natural Gas over the past 3 months, showing we plunged to new lows this week.

Summary of the past two weeks: Stock markets demonstrated renewed weakness, with the worst of it coming in the last days of this week. The bond market gained, especially late this week, as rates hit lows. The USD continued to appreciate. Energy prices continued to weaken, except for a bounce late Friday for oil. Lots of movement, lots of concern, lots of perceived uncertainty.
Let us look at some of the facts:
Oil:
The Energy Information Administration released their weekly inventory levels on Wednesday. Even in the face of low prices, cuts in rig use, etc., crude oil inventories were up 8.9 million barrels to 406.7 million barrels, the highest level for this time of year in 80 years! Crude inventories were up 137.% from this time last year and natural gas inventories are up 14.6% from last year. Net Import of Crude Oil were 9.5% below last year’s net imports. http://www.eia.gov/petroleum/supply/weekly/pdf/highlights.pdf These figures demonstrate the great level of oversupply occurring here in the US.
Here is an illustration of the stock figures from above:

Source: www.eia.gov
Natural gas- after a quick spike due to last week’s Northeastern snow storm, the price fell back to less than $3.00 per MMBtu:

The above natural gas price declines are counter to the projected cold weather in the NE:

Natural Gas Production continues to grow:

A bit of good news looking forward – increasing consumption of Nat Gas for electric power generation:

The shift here is not an increase in overall electric energy demand but the retirement of coal and petroleum fired and nuclear power plants. This shift is expected to continue as more coal plants are retired and more natural gas and renewable sourced plants come on line. http://www.eia.gov/naturalgas/weekly/archive/2015/01_29/index.cfm#tabs-prices-1
Rig counts for the week ended 1/30/15 were UP 3 units for natural gas w/w but down by 10.9% from last year. Oil rig counts were down by 94 units in the US this week and are down by 199 units or 14% y/y from 1,422 oil rigs this week last year. http://phx.corporate-ir.net/phoenix.zhtml?c=79687&p=irol-reportsother Several production executives believe that rig counts can decline by an additional 300 units over the coming months.
Interestingly though, oil prices JUMPED on Friday by 8% or $3.71 to $48.24 for WTI. This may have been a result of bits of news from the Middle East, announced cuts in cap-ex by US and international major producers, and short covering by traders (especially on a Friday afternoon.) We will wait to see what the coming weeks bring, but one can be confident that the market always eventually does balance supply and demand through pricing. We are hearing of cuts to production and limits to future investment in production, and with lower prices, folks are no so hesitant to drive a few more miles, which will increase consumption and demand (though total expenditures on gas will be lower than it had been.)
A point worth mentioning was that the new Saudi king has decided to retain Ali Al-Naimi as Saudi Oil Minister. This move assures that there will be no major changes in strategy and personnel as OPEC runs/rides the declining oil price wave. http://www.albawaba.com/business/real-crisis-master-what-will-happen-saudi-oil-policy-now-ali-al-naiimi-will-stay-place-6512
Oil and natural gas price declines reflect all the information that is now known regarding supply and inventory and the fear of slowing demand. It almost appears to price out the risk of issues in production in the Middle East or Russia, and assumes peace and unimpeded trade. It is good to be hopeful, but the environment will not be perfect for ever, unfortunately. In every market there is a limit to how low prices can go. At some point, buyers will step in when they anticipate they can make decent returns relative to risk.
The Fed:
The Fed on Tuesday, Jan 28th, released their latest comments. They noted that the economy is growing, but at a slow pace. Employment is improving, purchasing power increasing, business investment growing, but the housing growth is slow and household spending is only rising “moderately”. In reading the document, they note that inflation is “anticipated to decline further”, but should rise gradually towards 2%, and they are monitoring this closely. They note they can “be patient” in beginning to raise rates, and are continuing to reinvest proceeds from maturing bonds back into their portfolio. http://www.federalreserve.gov/newsevents/press/monetary/20150128a.htm The talking heads talked about how the Fed might begin moving rates as early as June, but within the Fed’s comments, there is clearly no indication of any intention to raise rates soon.
St. Louis Fed President Bullard was widely quoted this week as stating that asset bubbles will form if rates are kept too low for too long. This did receive headline attention, though he further went on to say that he did not see any indications of troubling bubbles at the current time. http://www.bloomberg.com/news/articles/2015-01-30/bullard-warns-of-asset-bubble-risk-if-fed-keeps-rates-too-low
GDP: The Bureau for Economic Analysis released their “Advance” Estimate of Real GDP at 2.6% for 4th quarter 2014 figures this past Friday. Many have blamed this report for fostering the further decline of the markets after a weak week, as analysts were expecting 3%. Consumer spending was strong. A few key items that negatively impacted the numbers included smaller growth in exports (up 2.8% vs 4.5% last q.) and real imports increasing by 8.9% vs a decline of 0.9% in prior q. [This will likely be a recurring theme given the strength of the USD.] Federal government spending had a significantly negative impact as it declined by 7.5% vs a 9.9% increase in the 3rd Q. Capital investments was an area of broad weakness. http://www.bea.gov/newsreleases/national/gdp/gdpnewsrelease.htm
Remember that these GDP figures from Friday are “advance” figures and only estimates. They are always subject to revision and the revisions can be large. GDP figures actually are released 3x for each quarter: 1st the “advance” figure approx. 30 days after period end, then the “Second” Estimate 4 weeks later, and then the “Third” Estimate 4 weeks after that. Given the amounts that the revisions change the growth rate, the “Advance” and “Second” are not really of any significant use in assessing the economy. It is too easy to be fooled by them. For example, 2014 3rd Q “Advance Estimate” was 3.5% released on October 30, 2014, the “Second” Estimate was 3.9% on 11/25/14, which then created a positive surprise on 12/23/14 when it was revised to 5.0%%!
Sources: http://www.bea.gov/newsreleases/national/gdp/2014/pdf/gdp3q14_2nd.pdf http://www.bea.gov/newsreleases/national/gdp/2014/gdp3q14_adv.htm http://www.whitehouse.gov/blog/2014/12/23/third-estimate-gdp-third-quarter-2014
Employment Cost Index:
This is a closely watched indicator of the cost of employees by the Fed and investing public. If this starts to rise significantly more than 2%, then wage inflation may be starting to take hold. Figures release for the 4th Q of 2014 indicated that there was a Quarter over Quarter increase of 0.6% and an annual increase of 2.2%. These numbers were consistent with expectations and reflected greater strength than Average Hourly Earnings, which had been reported earlier in the month as declining by 0.2%. Within the detail, the cost of benefits was up 2.6% y/y versus wages and salaries up 2.1% y/y. (The average hourly earnings numbers were up 1.7% y/y, released earlier in the month.) http://www.bls.gov/news.release/eci.nr0.htm
Consumer Sentiment:
January 2015 surveys indicated the best consumer sentiment in the past decade, with a figure of 98.1, up 20.8% from last year! The optimism was shared by households with incomes of more than $75k and by those with incomes less than $75k. http://www.sca.isr.umich.edu/ This bodes well for consumer spending and maintaining consumer demand into 2015.

Source: Bloomberg
Chicago Purchasing Mangers’ Index:
The December 2013 figures were revised upward from 58.3 to 58.8, and the January figure was released as 59.4, exceeding analysts’ estimates. The increase showed growth in new orders as well as production. The survey also found the lowest level of pricing pressures in 4.5 years driven by energy cost declines, as well as limited inflation elsewhere! Employment was also a strong positive. https://www.ism-chicago.org/chapters/ism-ismchicago/files/mni_chicago_press_release_2015-01.pdf
Pending Home Sales was a large disappointment and counter to expectations. For December it was down 3.7% and December closed sales was flat. Y/Y the index was up 6.1%. http://www.realtor.org/news-releases/2015/01/pending-home-sales-stall-in-december
Sales of existing homes in December increased, but total sales for the year was 3.1% lower than 2013. Median home prices increased 5.8% nationally, y/y. December’s inventory declined by 11.1% to 1.85 m units. Unsold units is 0.5% less than in prior year. December showed the 34th consecutive month of pricing gains. http://www.realtor.org/news-releases/2015/01/existing-home-sales-rebound-in-december-2014-total-sales-finish-3-percent-below-2013
Home ownership rates have fallen to their lowest levels in 20 years to 63.9% from 65.1% in Dec 2013 and its high of 59.2% in 2005. http://www.wsj.com/articles/homeowner-rate-falls-to-a-level-seen-in-94-1422592057
Uncle Sam has recently reduced insurance costs for low money down loans, as well as reduced sizes of down payments. Given the Gov’t bias to support housing ownership growth, one may potentially look to the Fed as an aid in this, by keeping rates low…. Though the Fed mandate has nothing to do with housing, it is an economic indicator they do follow.
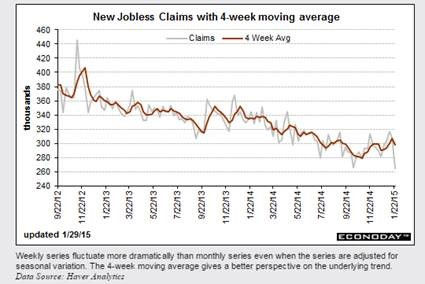
Jobless claims: Moving in the right direction!
Source: Bloomberg
The Advance Report on Durable Goods Orders was released on Tuesday and they fell by 3.4% in December, after declining by 2.1% in November. The numbers were particularly weak reflecting a decline in orders of 55% for Non-Defense Aircraft and Parts and 20% for Defense Aircraft and Parts. These figures reflect the current seasonal adjustments. In looking at the clean, unadjusted numbers all segments showed increased order levels versus November other than a small decline in Primary Metals. Comparing un adjusted December 2014 vs Dec 2013, all areas showed growth except for one large decline in Non-Defense Aircraft and Parts and two small declines in “Manufacturing with Unfilled Orders” and “Machinery”. http://www.census.gov/manufacturing/m3/adv/pdf/durgd.pdf
These figures are subject to adjustment, which certainly will occur. The question is to what extent and what direction.
Details to the published figures are not provided, and I have been unable to find any discussion anywhere of what may have driven the decline in Non-Defense Aircraft. Northern Trust was the only one to comment on it, noting that it “deserves further monitoring”. http://www.northerntrust.com/library/econ_research/daily/us/dd012705.pdf
In looking at America’s largest aircraft manufacturer for clues, I remain unilluminated. Boeing booked 174 new orders in December, representing 12% of their total orders booked for the year. December was considered “particularly successful” by the Center for Aviation. http://centreforaviation.com/analysis/airbus-and-boeing-2014-the-rain-of-orders-and-deliveries-continues-with-no-sign-of-slackening-202979
Boeing’s Book to Bill ratio exceeded 2:1 for 2014, even after record deliveries.
Many expect that lower aviation fuel costs will allow airlines to reinvest heavily in updating and adding new more fuel efficient aircraft and keeping Boeing’s orders growing.
The revisions to the Advance Report will be available likely this coming week. We will review it when it is released and will comment accordingly.
Corporate Earnings – As of the end of business on Friday, January 30th, 227 of the 500 companies in the S&P have reported 4th quarter earnings.
Average earnings growth was 2.1% and reported earnings beat estimates by 3.4%, on average.
Per FactSet, “80% have reported earnings above the mean estimate [of analysts] and 58% have reported sales above the mean estimate.” http://www.factset.com/websitefiles/PDFs/earningsinsight/earningsinsight_1.30.15
A few insightful charts generated by Yardeni Research:

Green line is the inverse of P/E. Thus, the lower the green line, the more “expensive” a stock is relative to earnings. But, if a stock’s price reflects the Present Value of future earnings, and the interest rate comes down, then given the actual formula, the discount rate comes down and the calculated value increases. We can see the direct correlation during period of time, 2011 to 2016, 95 to 98, 84 to 87, etc… This does support the argument that stock prices are not irrational.
Similar but different. This chart looks at actual yield, not “real” or inflation adjusted yield:

The recent logical correlation of P/E of stocks to bond’s “P/E” is clear for 2012-2015.
Summary and Commentary:
As noted, there was a mix of news. Though it seems like the US economy does continue to move forward. Many of the areas cited as weak are subject to revision and adjustment in subsequent reports. Earnings are not great, but definitely not bad. Forward views are muted rather than very optimistic. (This is good regarding keeping rate low.) The energy discount the country is receiving will be well used, and is the first such systemic change in inputs and structure than is a positive in more than 20 years. (We had a period of “peace dividends” after the “Wall” fell and the Cold War ended. But that ended with 9/11 and a tremendous increase in security costs with no benefit to productivity, etc. That was accompanied by the trillions of dollars spent in the two wars in the Middle East. Followed by the destruction of trillions of worth in the Credit Crash and Real Estate Crash of 2008-2009. More on this at some other time. )
Yes, the reduced price of energy is causing much pain to shareholders, dividend recipients, and the respective sectors of the energy economies. This will likely level out and then firm within the next 18 months, with recoveries in select market prices coming sooner.
The fear that the Fed must begin to restore normalcy to the Fed Funds Rate before the US and global economy is fundamentally sound, is likely the biggest fear of the US markets at the moment. Fed Chair Yellen has proven to be a capable and competent Chair with strong knowledge and foresight. I would be very surprised if the Fed were to move way too early.
As always, we are sticking to fundamentals in selecting investments in all areas. We are working hard to mitigate risks in the fixed income area, especially as bond yields have continued to fall even lower, (and with a possibility that they can continue to come down.) The US still has the highest rates of all the developed economies. Yes, it is deserved and driven by national growth rates and future expected inflation, BUT the US is not in a vacuum. Movements abroad do have significant impacts on our rates and prices.
Tons of information here, and much more out in the world. We continue to drill through the noise to understand, analyze, assess and then project.
Please reach out with any questions, and feel free to share this with anyone you may wish.
We are here to serve you!
Have a great SuperBowl!


Comments