


Even with positive US economic data, a step backwards this week in the markets - Updates and Thought
- Dec 13, 2014
- 5 min read
For the first week in eight weeks, the markets ended the week lower and no new highs were hit during the week. The Dow suffered its biggest one week loss since 2011 and ended the week at values last seen on October 31st. S&P 500 and Dow 30 indices, moved to 2002 from 2075 last Friday and to 17281 from 17859, respectively. Below is a chart of daily performance of the Dow over the past 3 months, with each vertical line representing one week.

This week there are a bunch of items to touch upon, due to some significant movements we are seeing. I have tried to include as many helpful, easy to understand charts, as a “Picture is worth 1000 words”. I hope you find it reasonably easy to follow.
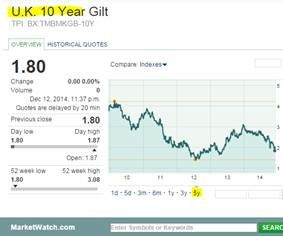
The ten year yield on Treasuries fell to 2.08% from 2.31% one week back. Yields on the German, Japanese, and UK 10 year bonds fell to their year’s lowest levels, while Spanish and Italian yields ticked up. Germany’s and Japan’s 10 year yield is the lowest in at least 5 years! http://www.marketwatch.com/ Note that this refers to yields set by the global markets, not Fed Funds Rates set by the Fed or other government-set rates. So the market has driven yields even lower, though the economists are moving projections for the Fed to raise rates sooner than late summer/fall 2015. (IMHO, I continue to think more likely in the second half of 2015 than the first half of 2015.)

Below are 5 year charts for 10 year bond yields for major economies.


Oil pricing leads the headlines for another week, ending Friday at $57.81 per barrel from $65.84 last Friday. http://www.nasdaq.com/markets/crude-oil.aspx?timeframe=7d

The following is an over simplification, but explains what is going on in the oil market: Global supply has increased over the past few years, but supply has recently grown to more than the demand. Hence, oversupply has emerged and prices have moved lower. (Economic challenges in Europe, Japan, China, etc. are all contributing factors in the slower growth of demand.) Per the latest figures from the US Energy Information Administration, the global production is expected to continue to increase into 2015, but decline in the 2nd half of 2015 when consumption is expected to exceed demand….. http://www.eia.gov/petroleum/weekly/

Here are some of the increasingly positive economic trends here in the US that demonstrate the current US economic strength and its potential direction:
US consumer confidence hit the highest level this month, since January 2007. http://www.bloomberg.com/news/2014-12-12/michigan-u-s-consumer-sentiment-index-rises-to-93-8-from-88-8.html
Gas prices are more than 50 cents lower than they were last year at this time, and the national average will likely fall below $2.50 per gallon by Christmas. http://fuelgaugereport.aaa.com/news/
US Producer Price Index declined by 0.2% for November. Over the 12 month period through November, it was up 1.4% annually. The report from the BLS attributes 60% of the decline to the change in gasoline prices. (Note, 40% of the decline was unrelated to energy. ) http://www.bls.gov/news.release/ppi.nr0.htm This may have an impact on the Fed’s statements coming out of the next Fed meeting.
Retail sales in November was up 0.7% over the prior month and 5.1% over November 2013. The monthly change was significantly larger than the increase in October. http://www.census.gov/retail/marts/www/marts_current.pdf
Mortgage applications to purchase a home rose by 1.3% in the week ended Dec. 5th. Applications to refinance have increased by 13.2%, spurred by rates near 4%. http://www.reuters.com/article/2014/12/10/us-usa-economy-mortgages-idUSKBN0JO16I20141210?feedType=RSS&feedName=businessNews
The Institute for Supply Management research projects manufacturing growth in the US for 2015 with revenues increasing by 5.6% and in non-manufacturing industries to increase by 10%, capital spending increasing by 3.7-3.8%, and employment headcount growing by 1.5-1.7%. http://www.ism.ws/about/MediaRoom/newsreleasedetail.cfm?ItemNumber=24452
Employment statistics continued to improve as job openings and new hires moved higher. The number of available US jobs increased in October to the second highest level in 14 years. Job openings have increased by 21% over the past 12 months and hiring has increased by 12% over that same period. http://news.morningstar.com/all/associated-press/d5dbc38bd37f4754af3824615baa9969/us-job-openings-rise-hiring-remains-healthy.aspx
The National Association for Business Economics forecasts that the US economy will expand by 3.1% in 2015, the best performance since 3.3% growth in 2005. http://www.washingtontimes.com/news/2014/dec/9/us-economy-set-for-growth-hiring-in-2015-financial/
Hence, things continue to look very good here in the US!
Earlier this week, Liz Ann Sonders, SVP and Chief Investment Strategist at Charles Schwab & Co., explained her perspective on the impact of the decline in oil prices in the US: "Consumer spending represents 68% of the U.S. economy. Oil and gas capex represents about 1% of U.S. GDP and less than 9% of U.S. total capex." "The benefit of lower energy prices to the consumer and many businesses greatly outweighs the significant hit to energy companies." http://www.businessinsider.com/monday-scouting-report-december-8-2014-2014-12
Here is a link to Liz Ann Sonders’ most recent “Schwab Market Perspective”: http://www.schwab.com/public/schwab/nn/articles/Market-Perspective She remains optimistic regarding the US stock markets for the first half of the new year. The article explains some of her rationale and underlying data points she is looking at.
Some other data points that caught my eye this week:
The changes in energy prices can have a drastic impact on individual countries around the globe that produce and export oil. Two charts to ponder:


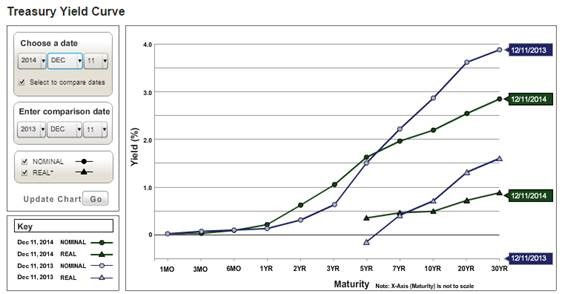
The “Yield Curve” is often a reasonably reliable indicator of future economic strength or weakness. As shown below, though the curve has flattened, it definitely is far from inverted. Hence, it continues to look “healthy” and positive for the US economy.
I share the following chart as it is an indication of the price an oil production company could have or can now contract to sell a barrel for, with delivery in 2015, 2016 or 2017. Though the price for delivery in the near term has declined by 50% based on the chart, the futures pricing has only declined by approximately 16%. Many companies will hedge between 40-90% of their production for the forthcoming 12-24 months. This chart shows that companies with a $60 breakeven, can still successfully contract to sell product at a profit, if they wish to remove market risk….

Thoughts:
As noted last week, we were and are continuing to expect volatility through year end. Friday’s activity may also have been driven a bit by the Congress’ inability to resolve government funding issues before the weekend. We expect this issue to resolve (ideally) by Monday morning. Rebalancing and tax loss harvesting will continue through year end as everything continues to shift.
The Fed has a two day meeting this week, the 16-17th, with their Policy Statement to be released at the close of their meeting this week. Though there is a widespread expectation that they will modify language indicating a rate increase may be sooner rather than later, the Fed realizes how closely the Statement is read and how nervous the markets are at the moment. Hence, there is a possibility that they will signal that they will continue to monitor and support economic growth as needed. This could potentially help to support the equity market in the face of declining oil prices.
We continue to remain optimistic about 2015, particularly for the US equity markets. Interestingly, Barron’s magazine’s lead article this weekend was “Outlook 2015: Stick with the Bull”. We are taking a cautious, diversified approach to fixed income, in recognition that rates will likely rise at some point in 2015. 2014 has turned out to “not be” a stock picker’s market. The upside performance of the index was driven by a very short list of companies that represented outsized percentages of the index, which prudent investors in working to manage risk, would have held less of or none of. 2015 likely will be a stock picker’s market driven by rebounds in overselling of positions in the final months of the year.
CapitalRock Investments LLC will be hosting a web-based update for clients this week. Please be on the look-out for an invitation to join us. For all readers, if you would like to be certain to receive an e-vite, please email me and we will send it out.
Have a great week!
Howard Isaacson, MBA, CRPC®


Comments